A belling (socketing) machine is the finishing workhorse in thermoplastic pipe production, forming the female end (socket) that enables leak-tight joints. The true cost of owning one is more than the sticker price: change parts, utilities, manpower, quality tooling, installation, and downtime all influence your return. This guide unpacks capital expenditures (CAPEX), operating expenditures (OPEX), line-level productivity assumptions, and a 5-year total cost of ownership (TCO) with example data and sensitivity analysis so you can budget confidently and benchmark vendors.
Scope & assumptions:
Data below are realistic manufacturer-style estimates for uPVC/CPVC/PP pipes from Ø50–Ø400 mm in a typical Asia/EMEA factory with grid electricity at $0.12/kWh and one 8-hour shift baseline. Replace the example figures with your actual quotes and local energy/labor rates.
What a Belling Machine Does—And Why It Drives Cost
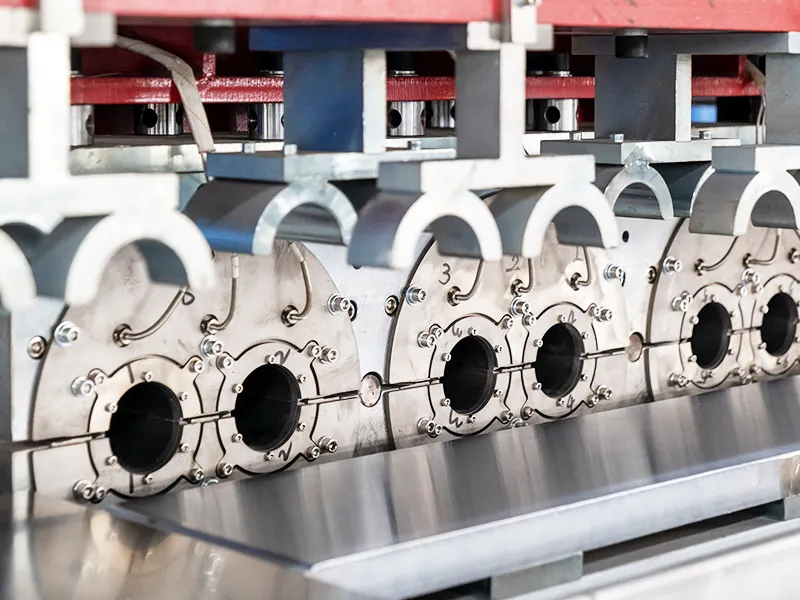
A belling machine heats a pipe end (hot-air, IR, or contact heating), forms a socket on a mandrel, cools the geometry, and often prints or calibrates the seal groove for gasketed joints. Because the socket is a sealing surface, repeatable temperature control, axial alignment, and cycle-time stability are critical. Machines vary by:
- Heating method: Hot air, IR/quartz, or contact (and combinations).
- Station count: Single, dual, or multi-station carousel for parallel forming.
- Automation: Manual loading, semi-automatic (auto cycle with manual load), fully automatic with infeed/outfeed and vision checks.
- Diameter range: Change parts (mandrels, sockets, collars) by pipe size/standard.
- Material: uPVC/CPVC/PP/PE; gasketed vs solvent socket, with/without groove.
These choices tie directly to CAPEX and ongoing costs (power, manpower, changeovers, scrap).
Cost Structure Overview
CAPEX (One-Time)
| Cost Element | What It Covers | Typical Range (USD) | Notes |
| Base machine | Frame, heating, forming stations, PLC/HMI | 55,000 – 180,000 | Multi-station and larger diameters cost more |
| Automation package | Infeed/outfeed conveyors, robot/gantry, sensors | 8,000 – 45,000 | Reduces labor, stabilizes throughput |
| Change parts | Mandrels, sockets, collars for each diameter | 1,500 – 6,000 per size | Gasket groove tools cost more |
| Tooling upgrades | Hard coatings, quick-change kits | 2,000 – 10,000 | Shortens changeover, reduces wear |
| Installation & commissioning | On-site setup, calibration | 3,000 – 12,000 | Travel may add 15–25% |
| Training | Operators, maintenance, QC | 1,500 – 5,000 | Include documentation in your language |
| Utilities hook-up | Power drops, compressed air, ventilation | 2,000 – 8,000 | Facility work varies widely |
| QA instruments | Go/no-go gauges, socket depth gauges, templates | 800 – 3,500 | Budget per pipe standard |
| Spare parts kit (Year 1) | Heaters, thermocouples, seals, bearings | 1,500 – 5,000 | Prevents unexpected downtime |
OPEX (Recurring)
| Cost Element | Driver | Typical Unit Cost | Calculation Example |
| Electricity | Heaters + fans + controls | $0.12/kWh | See Section 3 for kWh/part |
| Compressed air | Actuation, cooling jets | $0.02–$0.04/m³ | Depends on pneumatics config |
| Labor | Operators per shift | $4–$22/hour | Region & automation level |
| Maintenance | Preventive + corrective | 2–4% of machine CAPEX/yr | Includes heater banks, bearings |
| Consumables | Gaskets (QC), cleaners, labels | $0.001–$0.01/pipe | Minor but real |
| Scrap/rework | Misshaped sockets, overheats | 0.5–2.0% of output | Better temp control lowers rate |
| Changeover time | Lost production | — | See productivity model |
| Quality testing | Coupons, inspections | $0.001–$0.005/pipe | Tied to sample plan frequency |
Productivity & Utility Model (Example)
Representative Models
Model S (Semi-Auto, Hot Air, Single Station)
- Ø50–160 mm, manual loading, hot-air tunnel, foot/dual-hand start
Model A (Auto, Dual Station, IR + Air Cooling)
- Ø63–250 mm, auto infeed, dual station, IR heating, auto outfeed
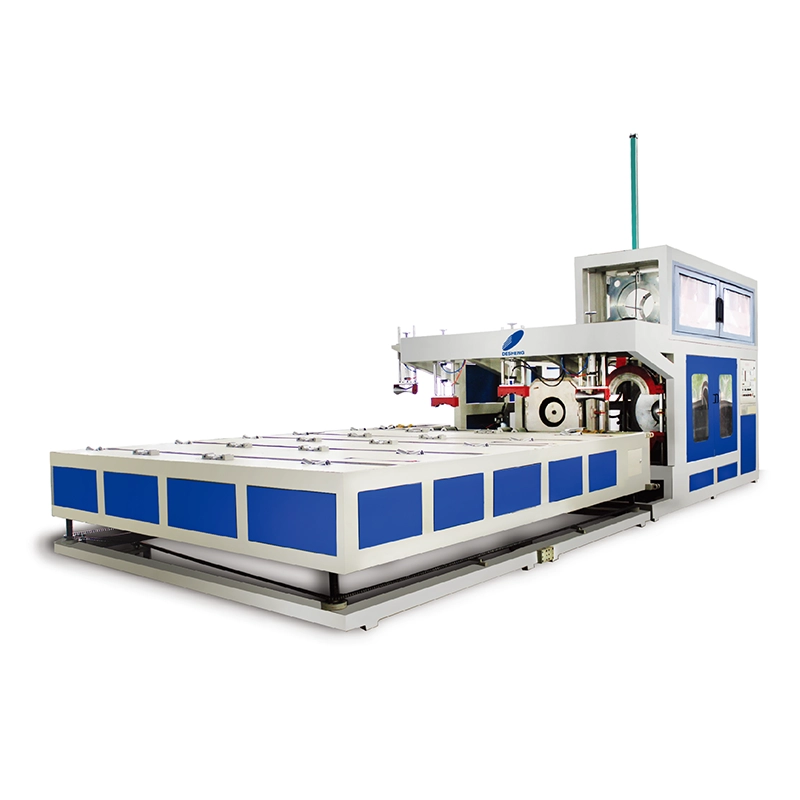
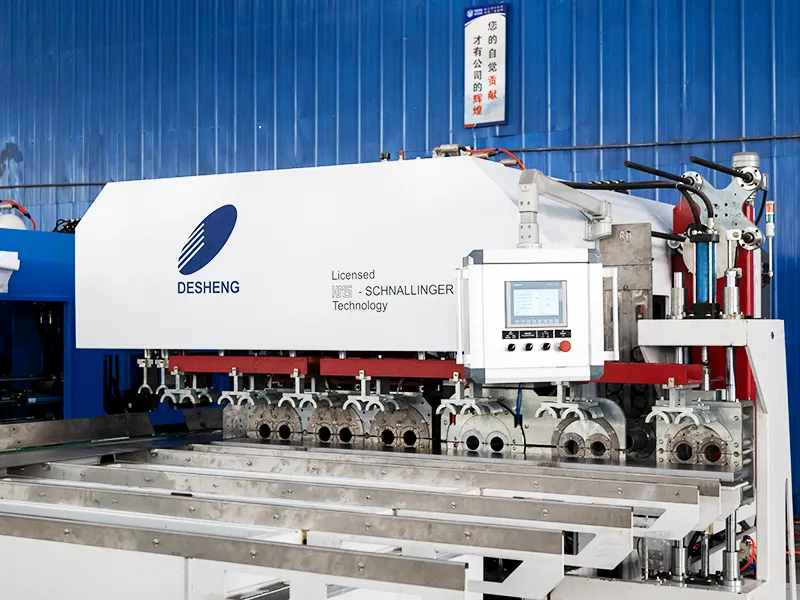
Model M (Multi-Station Carousel, IR + Calibrated Cooling, Vision QC)
- Ø110–400 mm, 4–6 stations, full automation, socket groove forming
Cycle Time & Output (Illustrative)
Assumptions: uPVC; 4.0 mm wall (Ø110 mm), 6.2 mm wall (Ø250 mm), 7.7 mm wall (Ø400 mm).
One 8-hour shift, 85% availability, 3% scrap baseline.
| Diameter | Model | Cycle Time (s) | Stations | Theoretical Pcs/hr | Net Pcs/shift (8h @85% avail, 3% scrap) |
| 110 mm | S | 22 | 1 | 163 | 1,074 |
| 110 mm | A | 14 | 2 | 514 | 3,385 |
| 110 mm | M | 9 | 4 | 1,600 | 10,540 |
| 250 mm | S | 36 | 1 | 100 | 660 |
| 250 mm | A | 24 | 2 | 300 | 1,980 |
| 250 mm | M | 16 | 4 | 900 | 5,940 |
| 400 mm | S | 55 | 1 | 65 | 429 |
| 400 mm | A | 38 | 2 | 189 | 1,248 |
| 400 mm | M | 26 | 6 | 831 | 5,487 |
Why it matters: The machine’s station count + heating method determine throughput. Faster cycles + more stations amortize labor and energy over more sellable pipes.
Energy Consumption (Illustrative)
Heater power depends on diameter and method. IR tends to be more energy-focused and faster on thicker walls; hot air is flexible but can be less efficient.
| Diameter | Model | Heater Power (kW) | Avg Draw During Cycle (kW) | kWh/pipe |
| 110 mm | S (Hot Air) | 14 | 9 | 0.055 |
| 110 mm | A (IR) | 12 | 7.5 | 0.029 |
| 110 mm | M (IR) | 20 | 13 | 0.033 |
| 250 mm | S (Hot Air) | 18 | 12 | 0.120 |
| 250 mm | A (IR) | 20 | 12 | 0.096 |
| 250 mm | M (IR) | 32 | 20 | 0.089 |
| 400 mm | S (Hot Air) | 22 | 15 | 0.230 |
| 400 mm | A (IR) | 28 | 18 | 0.182 |
| 400 mm | M (IR) | 45 | 28 | 0.202 |
Electricity cost per pipe = (kWh/pipe) × ($/kWh). With $0.12/kWh, 250 mm on Model A costs ≈ $0.0115/pipe in power.
Fully Loaded Cost per Pipe (Illustrative)
Let’s compute for 110 mm and 250 mm sockets on each machine class.
Assumptions:
Electricity: $0.12/kWh
Labor: $12/hour (loaded cost)
Operators:
- S = 1 operator
- A = 0.6 operator equivalent (one operator can tend two machines or inspector role)
- M = 0.8 operator (because larger line, packing, QC)
Maintenance: 3% of machine CAPEX per year
Planned availability: 85%
Scrap: 3%
Annual shifts: 2 shifts/day × 260 days = 520 shifts
Annualized Fixed Costs
We’ll assume representative CAPEX inside the earlier ranges:
| Model | Machine CAPEX | Maintenance (3%/yr) | Annual Shifts | Fixed Cost/Shift |
| S | $75,000 | $2,250 | 520 | $4.33 |
| A | $120,000 | $3,600 | 520 | $6.92 |
| M | $220,000 | $6,600 | 520 | $12.69 |
Fixed cost/shift here considers maintenance only; depreciation/finance are modeled in the TCO section. You can also spread CAPEX across expected life (e.g., 8–10 years) to get a depreciation per shift.
Variable Cost per Shift & per Pipe
| Parameter | S | A | M |
| Labor eq. (hr/shift) | 8.0 | 4.8 | 6.4 |
| Labor cost/shift | $96.00 | $57.60 | $76.80 |
| Electricity cost/shift* | diameter-dependent | diameter-dependent | diameter-dependent |
Electricity cost/shift = (kWh/pipe × net pcs/shift × $0.12)
Example: 110 mm
Net pcs/shift from Section 3.2
Electricity from Section 3.3
| Model | Net pcs/shift | kWh/pipe | Power Cost/shift | Labor/shift | Maint./shift | Cost/pipe (Labor + Power + Maint.) |
| S | 1,074 | 0.055 | $7.08 | $96.00 | $4.33 | $0.10 |
| A | 3,385 | 0.029 | $11.76 | $57.60 | $6.92 | $0.023 |
| M | 10,540 | 0.033 | $41.74 | $76.80 | $12.69 | $0.012 |
The fully automatic models dramatically reduce cost/pipe by spreading labor and fixed maintenance over more throughput.
Example: 250 mm
| Model | Net pcs/shift | kWh/pipe | Power Cost/shift | Labor/shift | Maint./shift | Cost/pipe |
| S | 660 | 0.120 | $9.50 | $96.00 | $4.33 | $0.166 |
| A | 1,980 | 0.096 | $22.82 | $57.60 | $6.92 | $0.045 |
| M | 5,940 | 0.089 | $63.68 | $76.80 | $12.69 | $0.026 |
Consumables and scrap cost are small per piece but add ~$0.002–$0.01/pipe depending on your QC plan and gasket proofs. Include them for precision.
Five-Year TCO & ROI (Worked Example)
Financial Assumptions
- Analysis horizon: 5 years
- Depreciation: Straight line over 10 years (book), but we’ll evaluate cash costs separately
- Discount rate (WACC or hurdle): 10%
- Electricity inflation: 3%/yr
- Labor inflation: 4%/yr
- Maintenance escalation: 2%/yr
- Production plan: Two 8-hour shifts, 260 days/year, diameter mix such that annual belling output = 1.5 million pipes
Selling price and margin are used only for ROI; you can swap in your own.
Compare Model A vs Model M
We assume same annual output (the higher-throughput machine simply runs fewer shifts for the same output).
| Item | Model A (Auto Dual) | Model M (Carousel) |
| Machine CAPEX | $120,000 | $220,000 |
| Automation add-ons | Included | Included |
| Change parts (5 sizes) | $18,000 | $24,000 |
| Install & training | $10,000 | $12,000 |
| Initial spares | $3,000 | $5,000 |
| Year-0 Cash Out | $151,000 | $261,000 |
Annual OPEX at Year-1 (power + labor + maint. + misc.), for the same 1.5 M pipes delivered:
- Model A cost/pipe from mix ≈ $0.036 → $54,000/yr
- Model M cost/pipe from mix ≈ $0.024 → $36,000/yr
Add maintenance (3% CAPEX):
- A: $3,600 → already included in above per-pipe estimate? If not, add here. For clarity, let’s keep maintenance inside OPEX totals above.
Cash Flow Summary (Illustrative):
| Year | Model A Cash Flow | Model M Cash Flow |
| 0 | -$151,000 | -$261,000 |
| 1 | -$54,000 | -$36,000 |
| 2 | -$55,620 | -$37,080 |
| 3 | -$57,288 | -$38,192 |
| 4 | -$59,006 | -$39,338 |
| 5 | -$60,776 | -$40,518 |
(Year-over-year increases reflect 3–4% inflation blended.)
NPV of 5-Year OPEX (10% discount):
- Model A ≈ -$254k (OPEX) + -$151k (Year-0) → -$405k
- Model M ≈ -$169k (OPEX) + -$261k (Year-0) → -$430k
At equal output, Model M spends ~$75–85k less OPEX NPV than Model A, but requires $110k higher CAPEX on Day 0. If your financing cost or capital constraints are tight, Model A might be preferable. If you’re volume-constrained or aiming to free shifts for other SKUs, Model M wins.
Payback via Margin Uplift
Assume belling/finishing allows you to sell at $0.06 higher contribution margin per pipe (compared to outsourcing socketing or selling plain-end only). On 1.5 M pipes/year, incremental margin ≈ $90,000/yr.
- Model A: Payback ≈ $151,000 / $90,000 ≈ 1.7 years
- Model M: Payback ≈ $261,000 / $90,000 ≈ 2.9 years
If Model M enables +30% volume without additional labor shifts (thanks to higher productivity), extra 450,000 pipes × $0.06 = $27,000/yr more margin. Now payback for Model M improves to ≈ 2.4 years.
Break-Even Volume & Scenario Analysis
Break-Even vs Outsourcing
Suppose outsourcing socketing costs $0.05/pipe. Your in-house cost per pipe (labor + power + maintenance + depreciation if you include it) determines the break-even.
| Machine | In-House Cost/pipe (mix) | Decision vs Outsourcing @ $0.05 |
| S | $0.08 | Outsource is cheaper unless labor is very low or volumes tiny |
| A | $0.036 | In-house is cheaper; invest |
| M | $0.024 | In-house strongly favored; invest, especially at scale |
Sensitivity (Cost/pipe, illustrative deltas)
- Electricity price +30%: +$0.002–$0.007/pipe (IR less sensitive than hot air)
- Labor +20%: +$0.004/pipe (S most sensitive; A and M diluted)
- Scrap +2 p.p. (from 3% → 5%): +$0.002–$0.006/pipe (hurts large diameters most)
- Changeover twice/day instead of once: Lost output +3–8% depending on QCC (quick-change) kit availability
- Heater bank replacement yearly instead of every 18 months: +$0.001/pipe
Hidden & Often-Ignored Costs
Change-part lead times: If you forecast new diameters next season, order tooling now. Waiting later ties up the machine.
Calibration templates and gauges: Socket depth, chamfer radius, groove geometry; budget per standard (ASTM, EN, ISO).
Ventilation & heat rejection: IR tunnels and hot-air zones dump heat; poor ventilation raises ambient temp and slows cooling cycles.
Compressed air quality: Water/oil in air lines damages seals and causes erratic actuation. Add filtration and dryers.
Data logging/traceability: If selling into regulated markets, you may need automated recordkeeping; factor in software licenses or PLC options.
Safety interlocks & guarding: Don’t assume full CE/UL compliance by default; confirm the scope and documentation.